A/B testing - The dos, the don’ts and the details!
In order to ensure your digital marketing campaign is the best it can be, extensive testing is crucial. One of the most popular and reliable methods is called A/B testing, sometimes referred to as split testing.
A/B testing is a method of optimizing your conversion rate by comparing two separate versions of the same web page and comparing their performance. In this article, you'll receive a primer on some key terms and concepts that you'll need to understand what A/B testing is all about, and why it's important.
Why Is A/B Testing Essential?
Let's say you're creating a landing page for your website. You have a nice, clean design, eye-catching images, and an effective call-to-action. You might like what you've come up with - but how do you know how will it perform once it's put into action? Will your landing page be effective for some audiences, but not for others? Could just a few simple changes be the key to a higher conversion rate?
That's where A/B testing comes in. With A/B testing you can create multiple variations of the same customer experience, and pinpoint which elements of your design are effective and which are detracting from the experience. Through testing, you can collect the data that will allow you to ask more focused questions about your design, which will help you make the changes your web page requires.
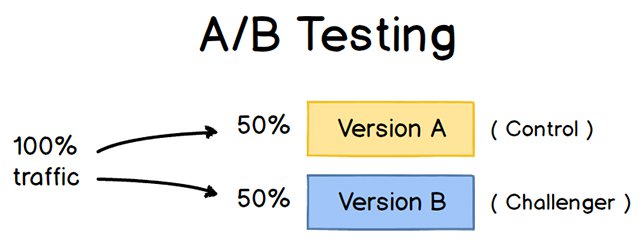
Image Credit: ConversionXL
What Can Be Tested?
You can create variations for any aspect of your page's layout, from copy (i.e. the words written on the page) to images to small design elements (where things are on the page and how they look). One group, for example, might be shown an email ad with a picture of a couple using the product or service, while another group might see an image of a single person. Or one landing page could have a large splash banner at the top boasting a special offer, while the other could be more subtle.
Some other elements that can be tested include:
- Links
- Call to action buttons
- Social proof
- Headlines
- Links
- Other design elements (colors, width of banners, etc.)
A/B Testing Process
When running your tests, it's important to be as thorough and scientific as possible. You want to approach it like an experiment, with a control group and different variables.
In order to run a successful A/B testing experiment, you'll need to take the following steps:
- Gather data. Use analytics to determine where people are bouncing from your conversion funnel. This will help you begin to develop your solution and inform where you should begin your a/b testing.
- Pick a specific variable to test. One of the most important things to keep in mind for A/B testing is that you need to test only one thing at a time between the A and B versions. If you test two completely different pages with different copy, images, and layout, you'll certainly find out which of the two are more effective. But you won't know why one is more effective than the other, or what specific parts of your page your customers are responding to. Maybe the page you found to be less effective would actually perform much better than the "superior" one with just a few key changes. Keep it focused.
- Identify a goal. Work to develop some metric by which you will measure success. Goals could include a higher clickthrough rate, more products sold, more email sign-ups, or whatever else that you want to improve.
- Form a hypothesis. Using the data you gathered earlier on what parts of your website are underperforming, construct a hypothesis of how they could be improved. An example hypothesis could look like: "With shorter and more concise copy on the landing page, conversion will be increased."
- Test your hypothesis. Randomly assign visitors on your website to either your new, experimental page, or your original one. Collect data on how your visitors react to both versions. You will need to let the test run for a while to get good results. How long this will take depends on your business and goals. ABTasty has a helpful calculator to help you determine how long your testing period should be.
- Examine your results. Compare the two versions to see which one collected the highest number of conversions. If the difference is unclear, revisit your hypothesis and create a new version that will give you more testable results.
- Make the necessary changes. If there's a clear winner, you can now implement the new page and start getting more conversions! You can also use the data you've collected to make changes to other parts of your website that might still need work.
With this basic scientific process in mind, it's time to go into more detail about what kind of information is useful, and the best practices to make sure you're making the most of your data. To do that, we'll have to put our statisticians' hats on and learn a few key terms.
Sampling
Whether or not your results are reliable is dependent in large part on the number of people who interacted with your landing page. The more times the test was conducted, the more likely that your results are representative of a larger population. Interactions with your page, whether it resulted in conversion or not, make up your samples. Collecting these samples is simply called sampling.
It's easy to see why collecting a large number of samples is crucial. Let's say only one person visited your page, but they ended up converting. That would mean your new page had a success rate of 100%. Nice! You're going to be rich!
You can see the obvious flaw in this logic - one person isn't representative of an entire population. If you're making changes and predictions, you have to be confident that you have enough data to do so. As your sample size grows, the data becomes more representative.
There's a lot of great free tools online for calculating your ideal sample size.
Statistical Significance
When working out your hypothesis for A/B testing, there are essentially only two possible results. Assuming that your statistical model is valid and reflects reality, either your new, experimental page will increase conversion rate or it will not.
But whenever you're using a finite sample of people to make predictions about the behavior of a wider population, there's always going to be a certain degree of uncertainty. This means we have to have some method of measuring this uncertainty in a scientific way. Statistical significance is a tool that helps us do this.
Statistical significance is the likelihood that the differences in conversion rates that you've measured between your control page and your experimental page are not simply due to random chance.
Statistical significance is achieved when the p-value is less than the significance level. This all might sound complicated, but it's actually pretty straightforward - the p-value simply refers to the probability that you would get the same results if your hypothesis wasn't true. The significance level is the probability of rejecting the null hypothesis given that it is true.
If you're running an experiment with a significance level of 95%, that means that, by your estimation, there's only a 5% chance that the differences you've measured are not statistically significant. Measuring statistical significance gives you more confidence in the data you've collected, which will be essential if you're planning on using it to make changes to your site.
Confidence Intervals
If statistical significance is the likelihood that your results are not due to random chance, your confidence interval is a more precise measure of their reliability.
Let's say your confidence interval rate for your new page is 10.0% ± 2.0%. This is stating that the average rate of conversion is 10%, plus or minus 2%. This 2% is called the margin of error, and it refers to how far the measurement will deviate from the average over multiple experiments. So, on average, between 8%-12% of people visiting your new page will convert. The smaller your margin of error, the more reliable your results are. It's up to you to compare that percentage to your tests of the old page to see which was more effective.
You may run into trouble if your confidence intervals overlap. For example, let's say your original page had a confidence interval of 5%-15%, and your new page had a confidence interval of 10%-20%. That would mean there's a 5% overlap, which could mean that your two versions are not statistically significant or your sample size is too small. Try revisiting your hypothesis and trying something different to see if that will give you more dramatic results, and thus more reliable data.
Understanding Errors
Unfortunately, no matter how solid your hypothesis, or how rigorous your methods, at some point, errors may occur during the testing process. There are two main types to watch out for: type I and type II errors.
A type I error is often referred to as a "false positive". A false positive occurs when the data seems to show a correlation that does not actually exist. If we concluded that your new landing page has a higher conversion rate than your previous one when it actually doesn't, we would be committing a type I error.
A type II error, conversely, is often referred to as a "false negative". A type II error occurs when the data you gather shows that a correlation doesn't exist when, actually, it does. If, for example, your new landing page had a higher conversion rate than the original, but your tests seem to show it had a lower one, that would signify that your results contain a type II error.
Reducing Type I Errors
Type I errors are fairly common. But if you aren't aware of them, they can have deadly consequences for your conversion rate. If you make a change to your web page based on faulty data, you risk negatively impacting your performance with audiences. To reduce your chance of getting Type I errors, try to get the biggest sample size possible for your experiment. The more people you have to observe, the more likely that your data will be more broadly representative of the population.
Reducing Type II Errors
Type II errors, while not quite as potentially damaging as type I errors, still represent faulty data. When is there a risk of a type II error? This type of error is often the result of a too-small sample size. One of the best ways to reduce your risk of getting a type II error is to run the experiment for a longer period of time to collect a wider swathe of data.
Blogger Peter Borden recommends letting your test run for several "cycles"::
When it doubt, run your tests longer, past the point at which your testing platform tells you to stop. Some experts suggest running your experiments until you’ve tracked many thousands of conversion events. But, in truth, it’s not really the number of conversions that matters; it’s whether the time frame of the test is long enough to capture variations on your site. Do you get more visitors or different conversion patterns on weekends or at night? You should allow for a few cycles of variability in order to normalize your data.
Another way to think of it is that statistical significance isn’t enough. Large sites like Threadless get thousands of conversions per hour, and can see significance from their testing efforts quite quickly. But this doesn’t mean they should only run their tests for a few hours. Rather, they should run their tests long enough to capture a representative sample of their users over time. It’s the variability cycle that matters, not so much the number of conversions.
Summary
There are plenty of examples out there of companies that have used A/B testing to astonishing effect. With a little work, your company could be one ofthem.
While you may be tempted to trust your gut when it comes to designing your web pages, and while you may personally like your website's copy, you'll never know how effective these elements really are unless you actually test them. A/B testing is a scientific way to determine which elements of your page's design are helping your conversion rate, and which ones aren't. But care must be taken during the process. Proper methodology and rigorous analysis are required to ensure your data, and the conclusions you've drawn from it, are reliable.
A/B testing is a complex topic, and we've just scratched the surface with this article. You don't need to have extensive knowledge of statistics and calculus to get started thinking about what areas of your web site could use improvement. The great thing about A/B testing is that it's not just a one-and-done process. It's not just about improving one tiny part of your website then forgetting about it. Once you've conducted the testing and gathered the data, you can can apply the lessons you've learned across your entire website, and improve your customers' experience overall.
Sources Linked Above:
https://www.abtasty.com/sample-size-calculator/
http://www.evanmiller.org/ab-testing/sample-size.html
https://blog.sumall.com/journal/optimizely-got-me-fired.html
https://www.designforfounders.com/ab-testing-examples/